ECE 486 Control Systems
Lecture 5
System Modeling Diagrams
We saw more examples of system responses last time, where we noticed that frequency response formula we derived in Lecture 3 only gives steady-state component whereas Inverse Laplace transform includes both transient and steady-state components of the system response. We also saw nonzero initial conditions would bring extra terms to Laplace transform of derivatives of a time domain signal; the immediate consequence of this is transfer function can only be derived on occasions when zero initial condition is assumed. DC gain was briefly discussed at the end of last lecture and we used a quick example to illustrate how to use Final Value Theorem to compute DC gain given a system transfer function.
In this lecture, we will introduce block diagram with which we can visualize the algebra represented by differential equations for a given system, i.e., we can easily represent and analyze this system by means of block diagrams.
\begin{align*} \text{Large system } \begin{array}{cc} \xrightarrow{\text{decompose}}\\ \xleftarrow[\text{compose}]{} \end{array} \text{ Subsystems with smaller blocks} \end{align*}Usually, a system will be composed of subsystems with smaller blocks and these smaller blocks come from some given library. They are used as building blocks for more complicated systems. (Think of Lego bricks.)
All-Integrator Diagrams
Our library will consist of three building blocks,

Figure 1: Integrator
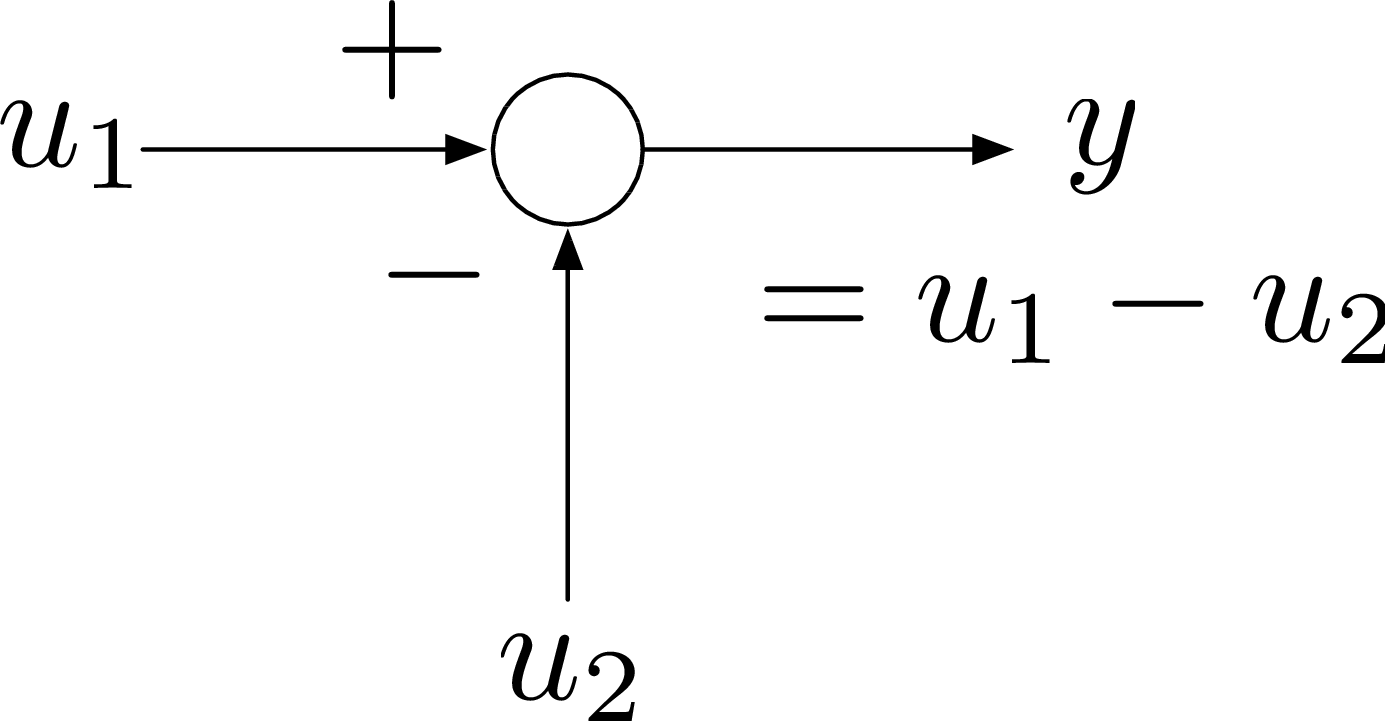
Figure 2: Summer

Figure 3: Gain
Figures 1 – 3 show integrator, summing junction and constant gain blocks.
Here are two caveats:
- We can (and will) work either with \(u,y\) (time domain) or with \(U,Y\) ($s$-domain) often going back and forth.
- When working with block diagrams, we typically ignore initial conditions.
In the lecture, this is the lowest level we will delve into; in the labs, these blocks can be implemented using op amps. More details can be found in Appendix B. of the lab manual.
Example 1: Draw an all-integrator diagram for system dynamics \[ \ddot{y}(t) = u(t) \text{ or equivalently } s^2 Y(s) = U(s). \]
Solution: Recall the “chain” method we talked about before, leave the system output on the right and trace back based on the degree of the highest order term of the differential equation. In this case it is \(2\), we need two integrators.

or equivalently in $s$-domain,

Example 2: By introducing two extra \(\dot{y}(t)\) and \(y(t)\) terms to the left hand side of system dynamics of Example 1, we have a new system dynamics
\begin{align*} \ddot{y}(t) + a_1 \dot{y}(t) + a_0 y(t) = u(t) \Longleftrightarrow &~ s^2 Y(s) + a_1 s Y(s) + a_0 Y(s) = U(s), \\ & \text{or equivalently } Y(s) = \frac{1}{s^2 + a_1 s + a_0}U(s). \end{align*}Draw an all-integrator diagram for the new system.
Solution: Keep the highest derivative on one side and everything else on the other,
\begin{align*} \ddot{y} = \underbrace{-a_1 \dot{y} - a_0 y + u}_{=v}. \end{align*}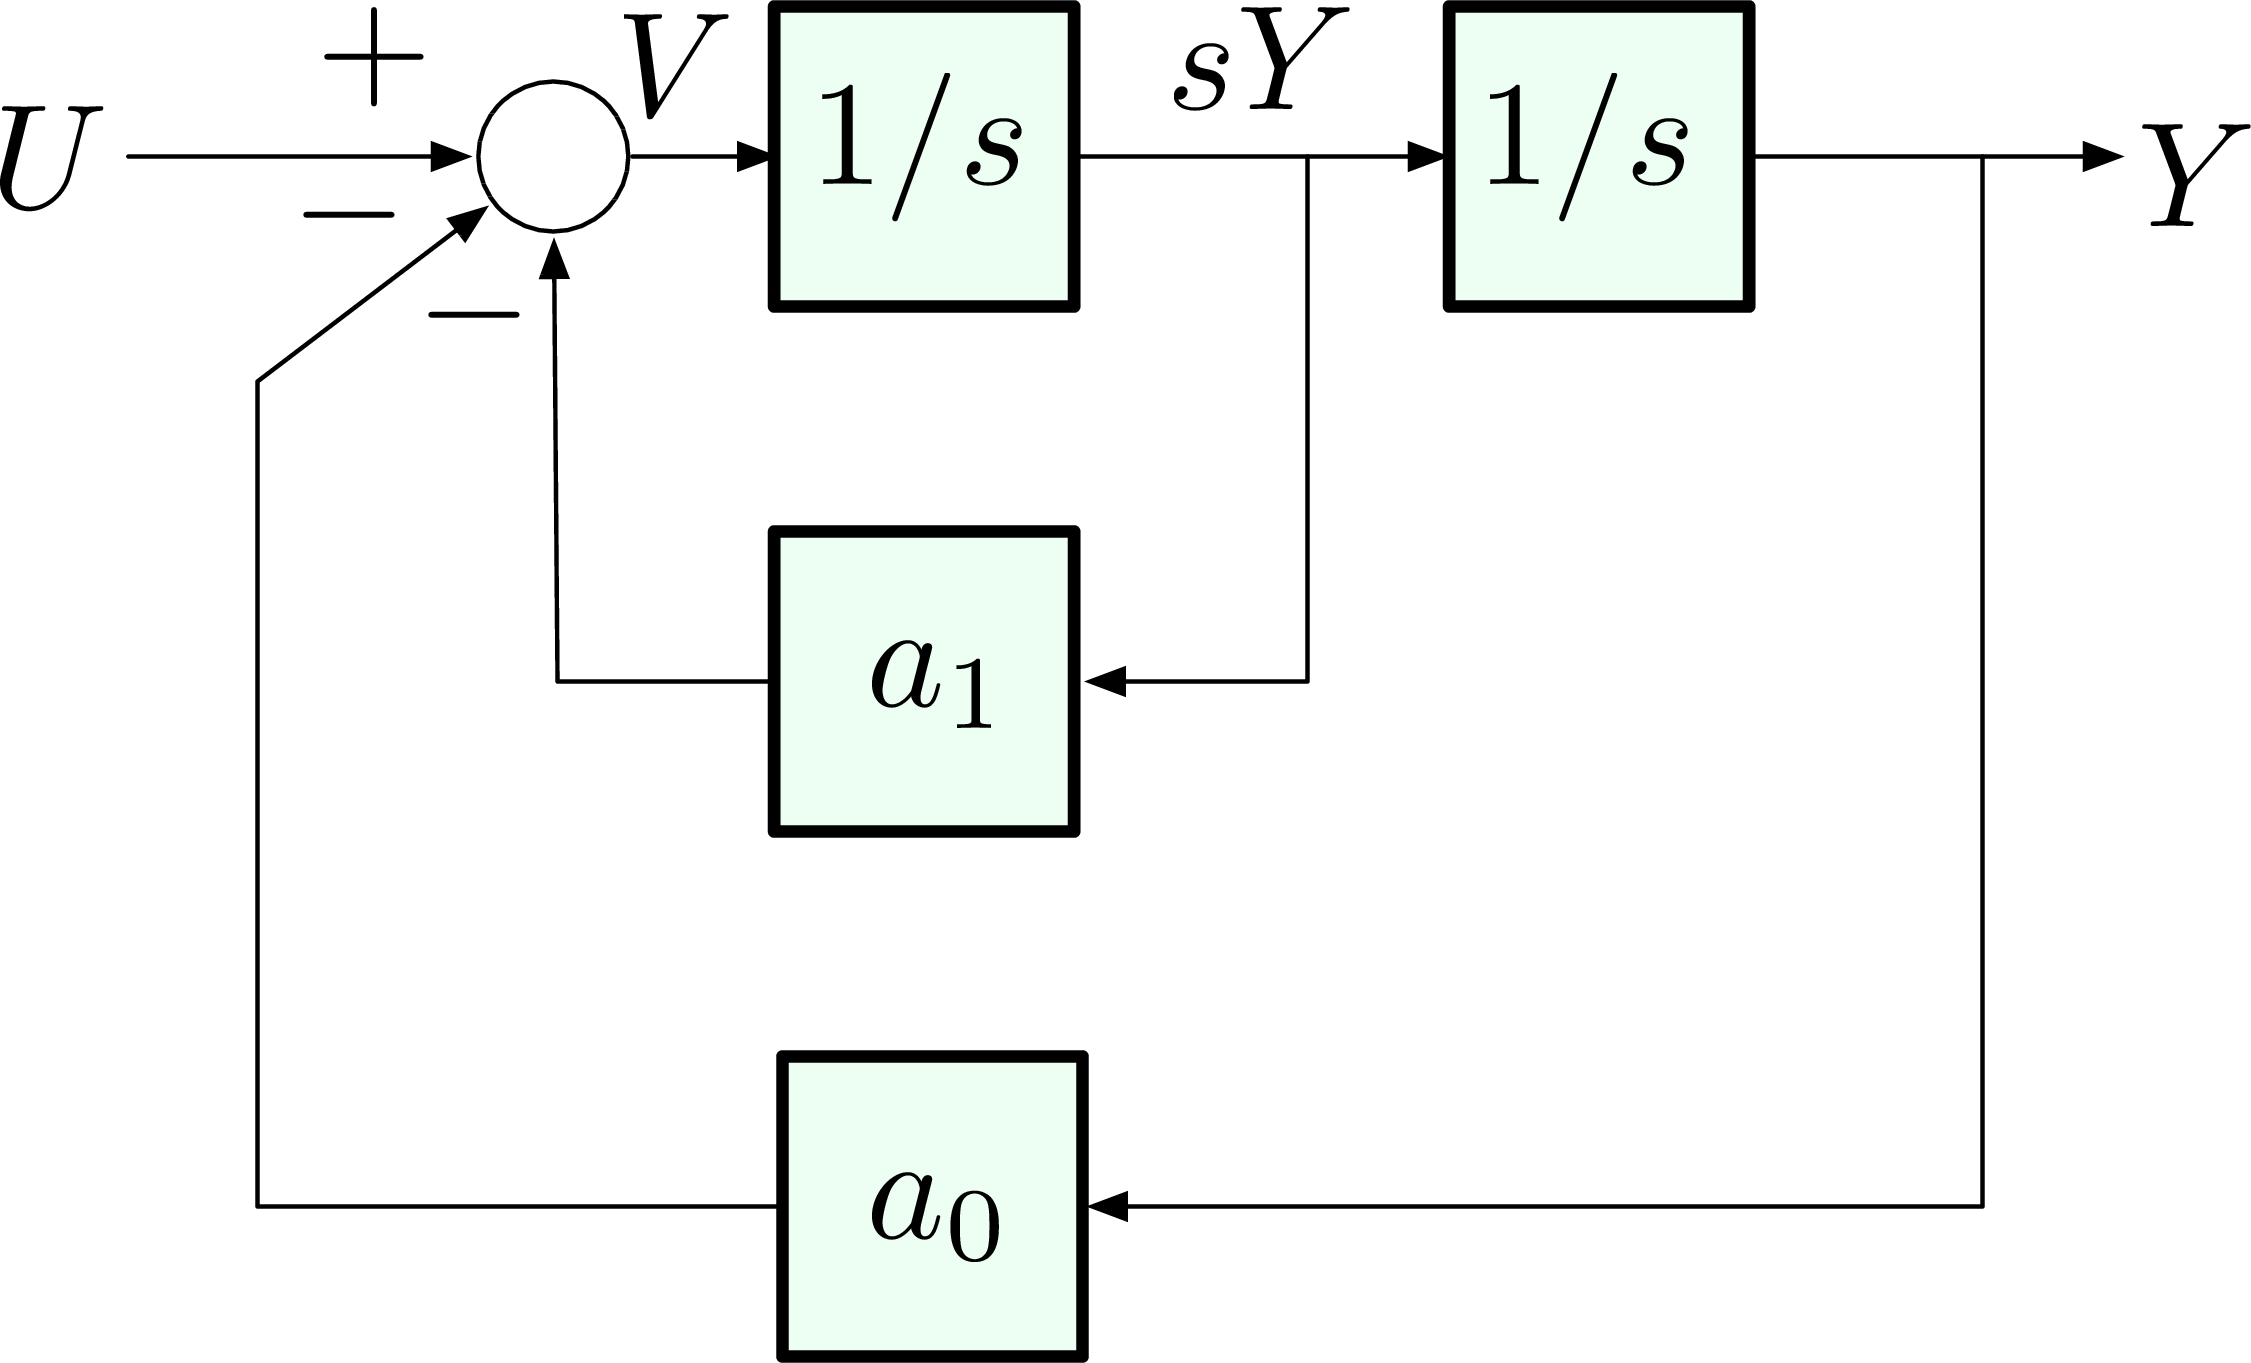
Compare the above new diagram with Example 1, the chain of integrators stays the same but we included two feedback loops and one summing junction because of the two extra terms we introduced.
Example 3: The transfer function in Example 2 has a trivial numerator \(1\). In this example, consider the transfer function with nontrivial numerator \(b_1s + b_0\) but with the same denominator as before, \[ H(s) = \frac{b_1s + b_0}{s^2 + a_1 s + a_0}. \] Draw an all-integrator diagram for this new transfer function.
Solution: We can complete this with three major steps.
Step 1: Decompose \(H(s) = \dfrac{1}{s^2 + a_1 s + a_0} \cdot (b_1 s + b_0)\), i.e., rewrite it as the product of two blocks.

Figure 7: \(U \to X \to Y\) with \(X\) as intermediate
The intermediate \(X\) is an auxiliary signal.
Tip: \(b_0 + b_1 s\) involves differentiation of \(U(s)\), which we cannot implement using an all-integrator diagram intuitively. But we will see that we don’t need to do it directly.
Step 2: The transformation \(U(s) \to X(s)\) has been done in Example 2.

- Step 3: We notice that by Figure 7, \(X(s) \to Y(s)\),
\[ \tag{1} \label{d5_ex3} Y(s) = b_1 s X(s) + b_0 X(s). \]
However both \(X(s)\) and \(sX(s)\) (derivative term) are available signals in the diagram in Step 2. Wire them up according to Equation \eqref{d5_ex3}, on top of the diagram in Step 2. Therefore the block diagram for transfer function \(H(s) = \dfrac{b_1 s + b_0}{s^2 + a_1 s + a_0}\) is
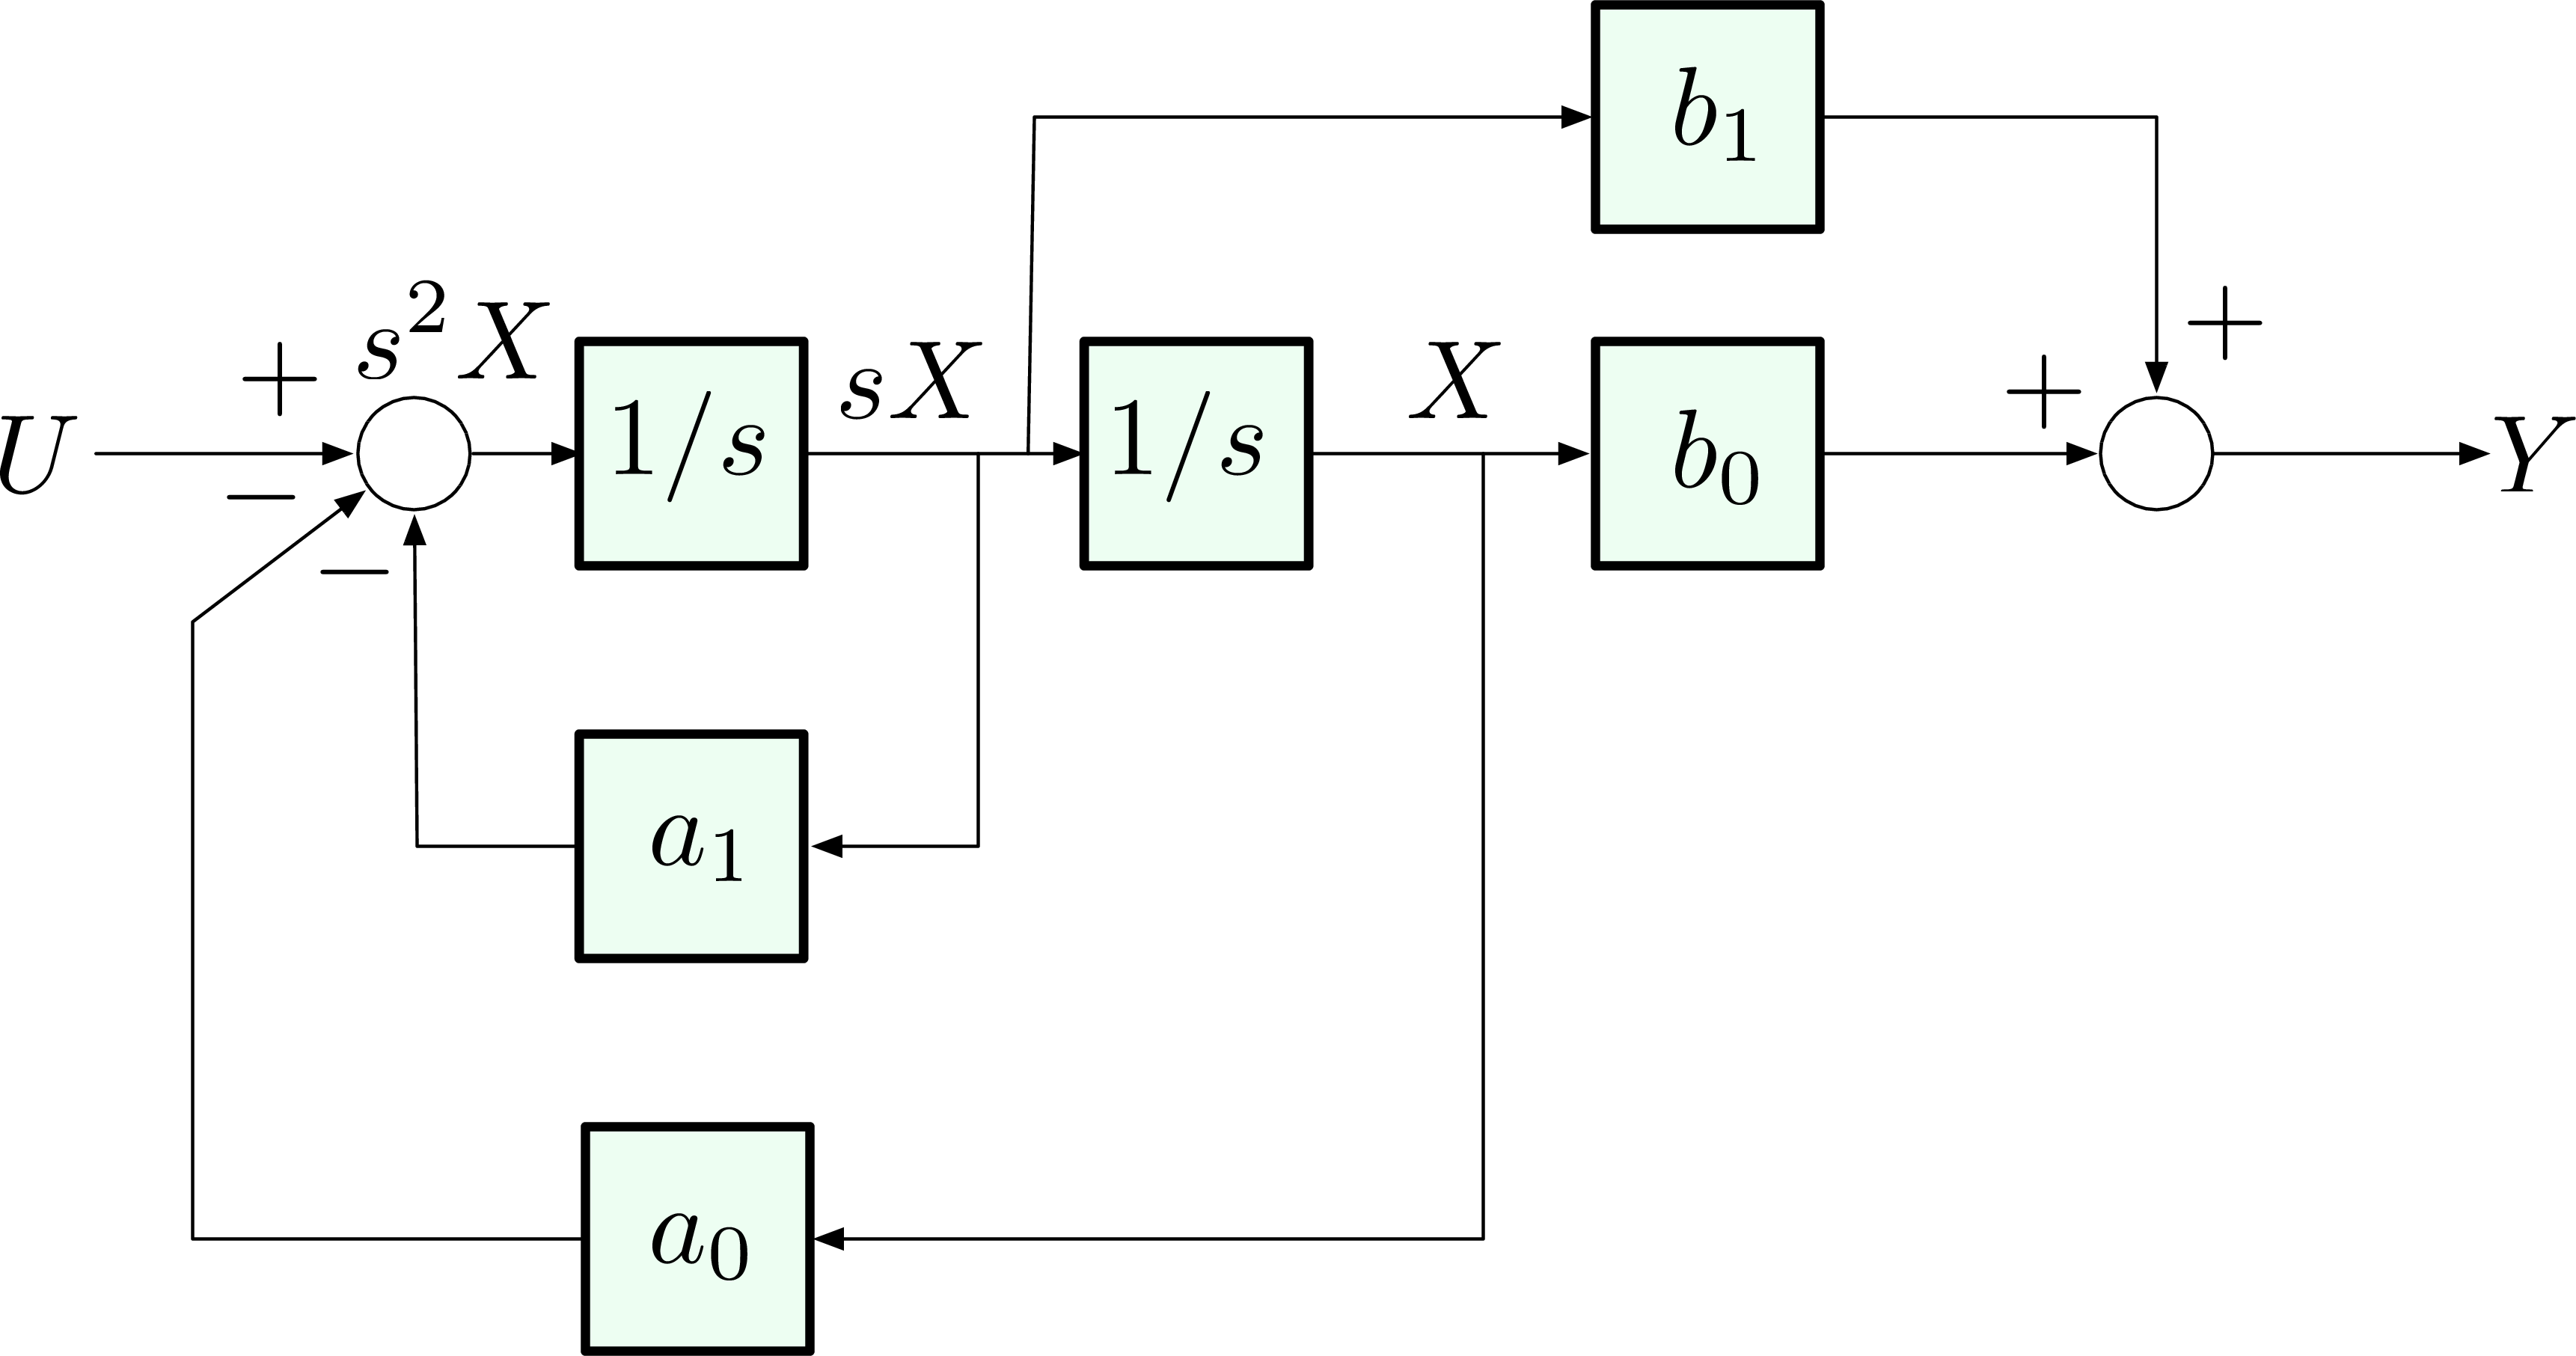
Figure 9: Block diagram for Example 3
We can write a state-space model as well by Figure 9,
\begin{align*} s^2 X &= U - a_1 sX - a_0 X, \text{ or in time domain,}\\ \ddot{x} &= -a_1 \dot{x} - a_0 x + u; \\ Y &= b_1 s X + b_0 X, \text{ or in time domain,} \\ y &= b_1 \dot{x} + b_0 x. \end{align*}Labeling the states along the chain, \(x \triangleq x_1\), \(\dot{x} \triangleq x_2\), we have system dynamics equation
\begin{align*} \left( \begin{matrix} \dot{x}_1 \\ \dot{x}_2 \end{matrix} \right) = \left( \begin{matrix} 0 & 1 \\ -a_0 & -a_1 \end{matrix}\right) \left( \begin{matrix} {x}_1 \\ {x}_2 \end{matrix} \right) + \left(\begin{matrix} 0 \\ 1 \end{matrix}\right)u, \end{align*}and system output equation is
\begin{align*} y = \left( \begin{matrix} b_0 & b_1 \end{matrix}\right)\left(\begin{matrix}x_1 \\ x_2\end{matrix}\right). \end{align*}This form is the $2$-dimensional case of the general $n$-dimensional controllable canonical form. Control \(U(s)\) enters a chain of integrators, it has the ability to move every state, hence the name controllable.
Important: For a given system transfer function \(H(s)\), the diagram is not unique. But, once a diagram is drawn, the state-space model equations are unique (up to coordinate transformations).
Basic System Interconnections
Now we move a level higher, we will talk about building complex systems from smaller blocks, without worrying about how those blocks look on the inside, e.g., smaller blocks could themselves be all-integrator diagrams like the ones we drew in Examples 1 through 3.
Block diagrams are an abstraction in the sense that they hide unnecessary “low-level” details; they describe the flow of information.
Series and Parallel Structure
Consider the series connection in Figure 10,

Figure 10: Series connection
where \(G_1(s)\), \(G_2(s)\) are transfer functions. The choice of the notation \(G(s)\) comes from the “gain” when we consider frequency response. Since input \(U(s)\) goes through \(G_1, G_2\) blocks sequentially,
\[\dfrac{Y(s)}{U(s)} = G_1(s) G_2(s).\]
We can consolidate the two blocks \(G_1, G_2\) and use one single reduced block \(G_1G_2\) instead,

Figure 11: Series connection (reduced)
Note that in this course, we seldom see Multi-Input Multi-Output (MIMO) systems, so the order of \(G_1\) and \(G_2\) does not matter for SISO systems. (Otherwise in Figure 11, \(Y = G_2 G_1 U\) since \(U\) hits \(G_1\) first then \(G_2\). All following blocks shall be stacked on the left one after another like matrix multiplication in linear algebra.)
Now consider the parallel connection in Figure 12,
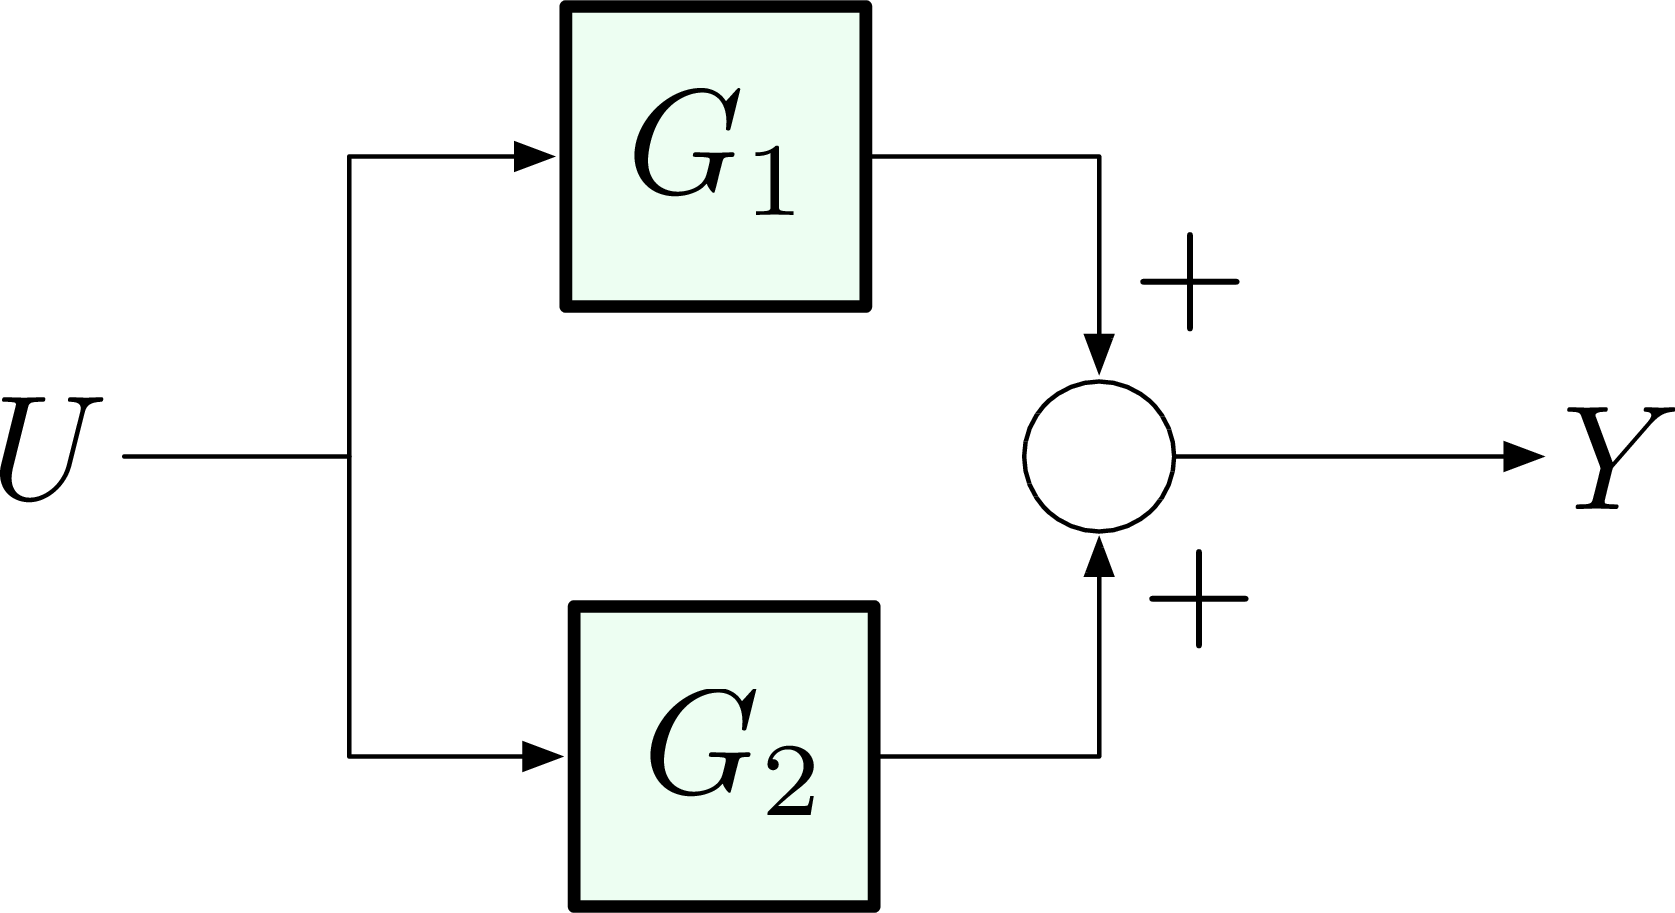
Figure 12: Parallel connection
system output \(Y(s) = G_1(s)U(s) + G_2(s)U(s)\), i.e., the sum of two branches due to input \(U(s)\). We have the transfer function
\[\dfrac{Y(s)}{U(s)} = G_1(s) + G_2(s).\]
Then the reduced diagram for parallel connection is,

Figure 13: Parallel connection (reduced)
Negative Feedback and Unity Feedback
The third type of connection is called negative feedback as in Figure 14,

Figure 14: Negative feedback
First we can compute the system transfer function from reference \(R(s)\) to output \(Y(s)\),
\begin{align*} U &= R - W, \\ Y &= G_1 U \\ &= G_1(R-W) \\ &= G_1 R - G_1 G_2 Y. \tag{2} \label{d5_eq2} \end{align*}Solving for \(Y(s)\) from Equation \eqref{d5_eq2},
\[ Y(s) = \frac{G_1(s)}{1+G_1(s)G_2(s)}R(s). \]
Then we have a simplified single-block diagram for Figure 14,

Figure 15: Negative feedback (reduced)
Abuse of Notation: The \(U\) signal in Figure 15 is a generic notation for input, not the same as control input \(U\) to \(G_1\) as in Figure 14.
It reads in natural language
\[ \text{negative feedback loop gain} = \frac{\text{forward gain}}{1+\text{loop gain}}. \]
We can either memorize it or derive it whenever it is needed.
One special case of negative feedback is when \(G_2(s) = 1\) or rather we move \(G_2(s)\) block from feedback path to forward path.

Figure 16: Unity feedback
This is called unity feedback –there is no component on the feedback path or feedback path is trivial \(1\). Recall the terminology we used in Lecture 1,
- \(R\) = Reference
- \(U\) = Control input
- \(Y\) = Output
- \(E\) = Error
- \(G_1\) = Plant (also denoted by \(P\))
- \(G_2\) = Controller or compensator (also denoted by \(C\) or \(K\))
Derivation of the following three very important transfer functions will be left as an exercise. (Apply formula we derived for gain of negative feedback loop.)
Reference \(R\) to output \(Y\),
\begin{align*} \frac{Y}{R} = \frac{G_1G_2}{1+G_1G_2}. \end{align*}Reference \(R\) to control input \(U\),
\begin{align*} \frac{U}{R} = \frac{G_2}{1+G_1G_2}. \end{align*}Error \(E\) to output \(Y\),
\begin{align*} \frac{Y}{E} = G_1 G_2. \qquad \text{(no feedback path)} \end{align*}
Question: We computed transfer function from reference \(R(s)\) to system output \(Y(s)\). Now what is the transfer function from reference input \(R(s)\) to Error \(E(s)\)?
Hint: Transfer function \(\frac{E(s)}{R(s)}\) is useful when we discuss tracking problem.
Block Diagram Reduction
Now with the already discussed series, parallel, and feedback interconnections at our disposal, given a complicated diagram made up of some combination of those blocks, we can possibly write down an overall transfer function from one of the variables to another.
In general,
- Name all the variables in the diagram;
- Write down as many relationships between these variables as we can;
- Learn to recognize series, parallel, and feedback interconnections;
- Replace them by their equivalents;
- Repeat.
More examples can be found in Section 3.2, FPE of our text.
Prototype Second Order System
What we have seen so far are transfer functions that have either real poles or purely imaginary poles,
\[ \frac{1}{s+a}, \, \frac{1}{(s+a)(s+b)}, \, \frac{1}{s^2 + \omega^2}. \]
We can also consider the case when system transfer functions have complex poles, i.e., the ones that have \({\rm Re}(s) \neq 0\) and \({\rm Im}(s) \neq 0\). For now, we will only look at second order systems, but this will be sufficient to develop some nontrivial intuition when we discuss dominant poles. We shall also see second order systems immediately in Lab 1.
A prototype second order system transfer function is a transfer function of the form
\begin{align*} H(s) &= \frac{\omega^2_n}{s^2 + 2\zeta\omega_n s + \omega^2_n}, \end{align*}where
- \(\zeta > 0, \omega_n > 0\) are arbitrary parameters in \(\RR_{>0}\);
- the denominator is a general second degree monic polynomial; here it is just written in a fancy way. The number \(\zeta\) is called damping or damping ratio; \(\omega_n\) is called natural frequency;
- \(H(s)\) is normalized to have DC gain \(= 1\), if DC gain exists.
By the quadratic formula, the pair of poles of transfer function \(H(s)\) are,
\begin{align*} s &= - \zeta \omega_n \pm \omega_n \sqrt{\zeta^2-1} \\ &= - \omega_n \left( \zeta \pm \sqrt{\zeta^2-1} \right) . \end{align*}The nature of the poles changes depending on \(\zeta\),
- if \(\zeta > 1\), both poles are real and negative;
- if \(\zeta = 1\), two repeated real negative poles;
- if \(\zeta < 1\), two complex poles with negative real parts, \(s = -\sigma \pm j \omega_d\), where \(\sigma = \zeta \omega_n\), \(\omega_d = \omega_n \sqrt{1-\zeta^2}\) .
The above three cases are called overdamped, critically damped and underdamped respectively. If \(\zeta = 0\), we follow the convention that there is no damping (\(\omega_d = \omega_n\)) in a system.
Let’s consider the underdamped system transfer function first.
\begin{align*} H(s) &= \frac{\omega^2_n}{s^2 + 2\zeta\omega_n s + \omega^2_n}, \mbox{ with } \zeta < 1. \end{align*}The poles are
\begin{align*} s &= - \zeta \omega_n \pm j\omega_n \sqrt{1-\zeta^2} \\ &= - \sigma \pm j\omega_d, \tag{3} \label{d5_eq3} \end{align*}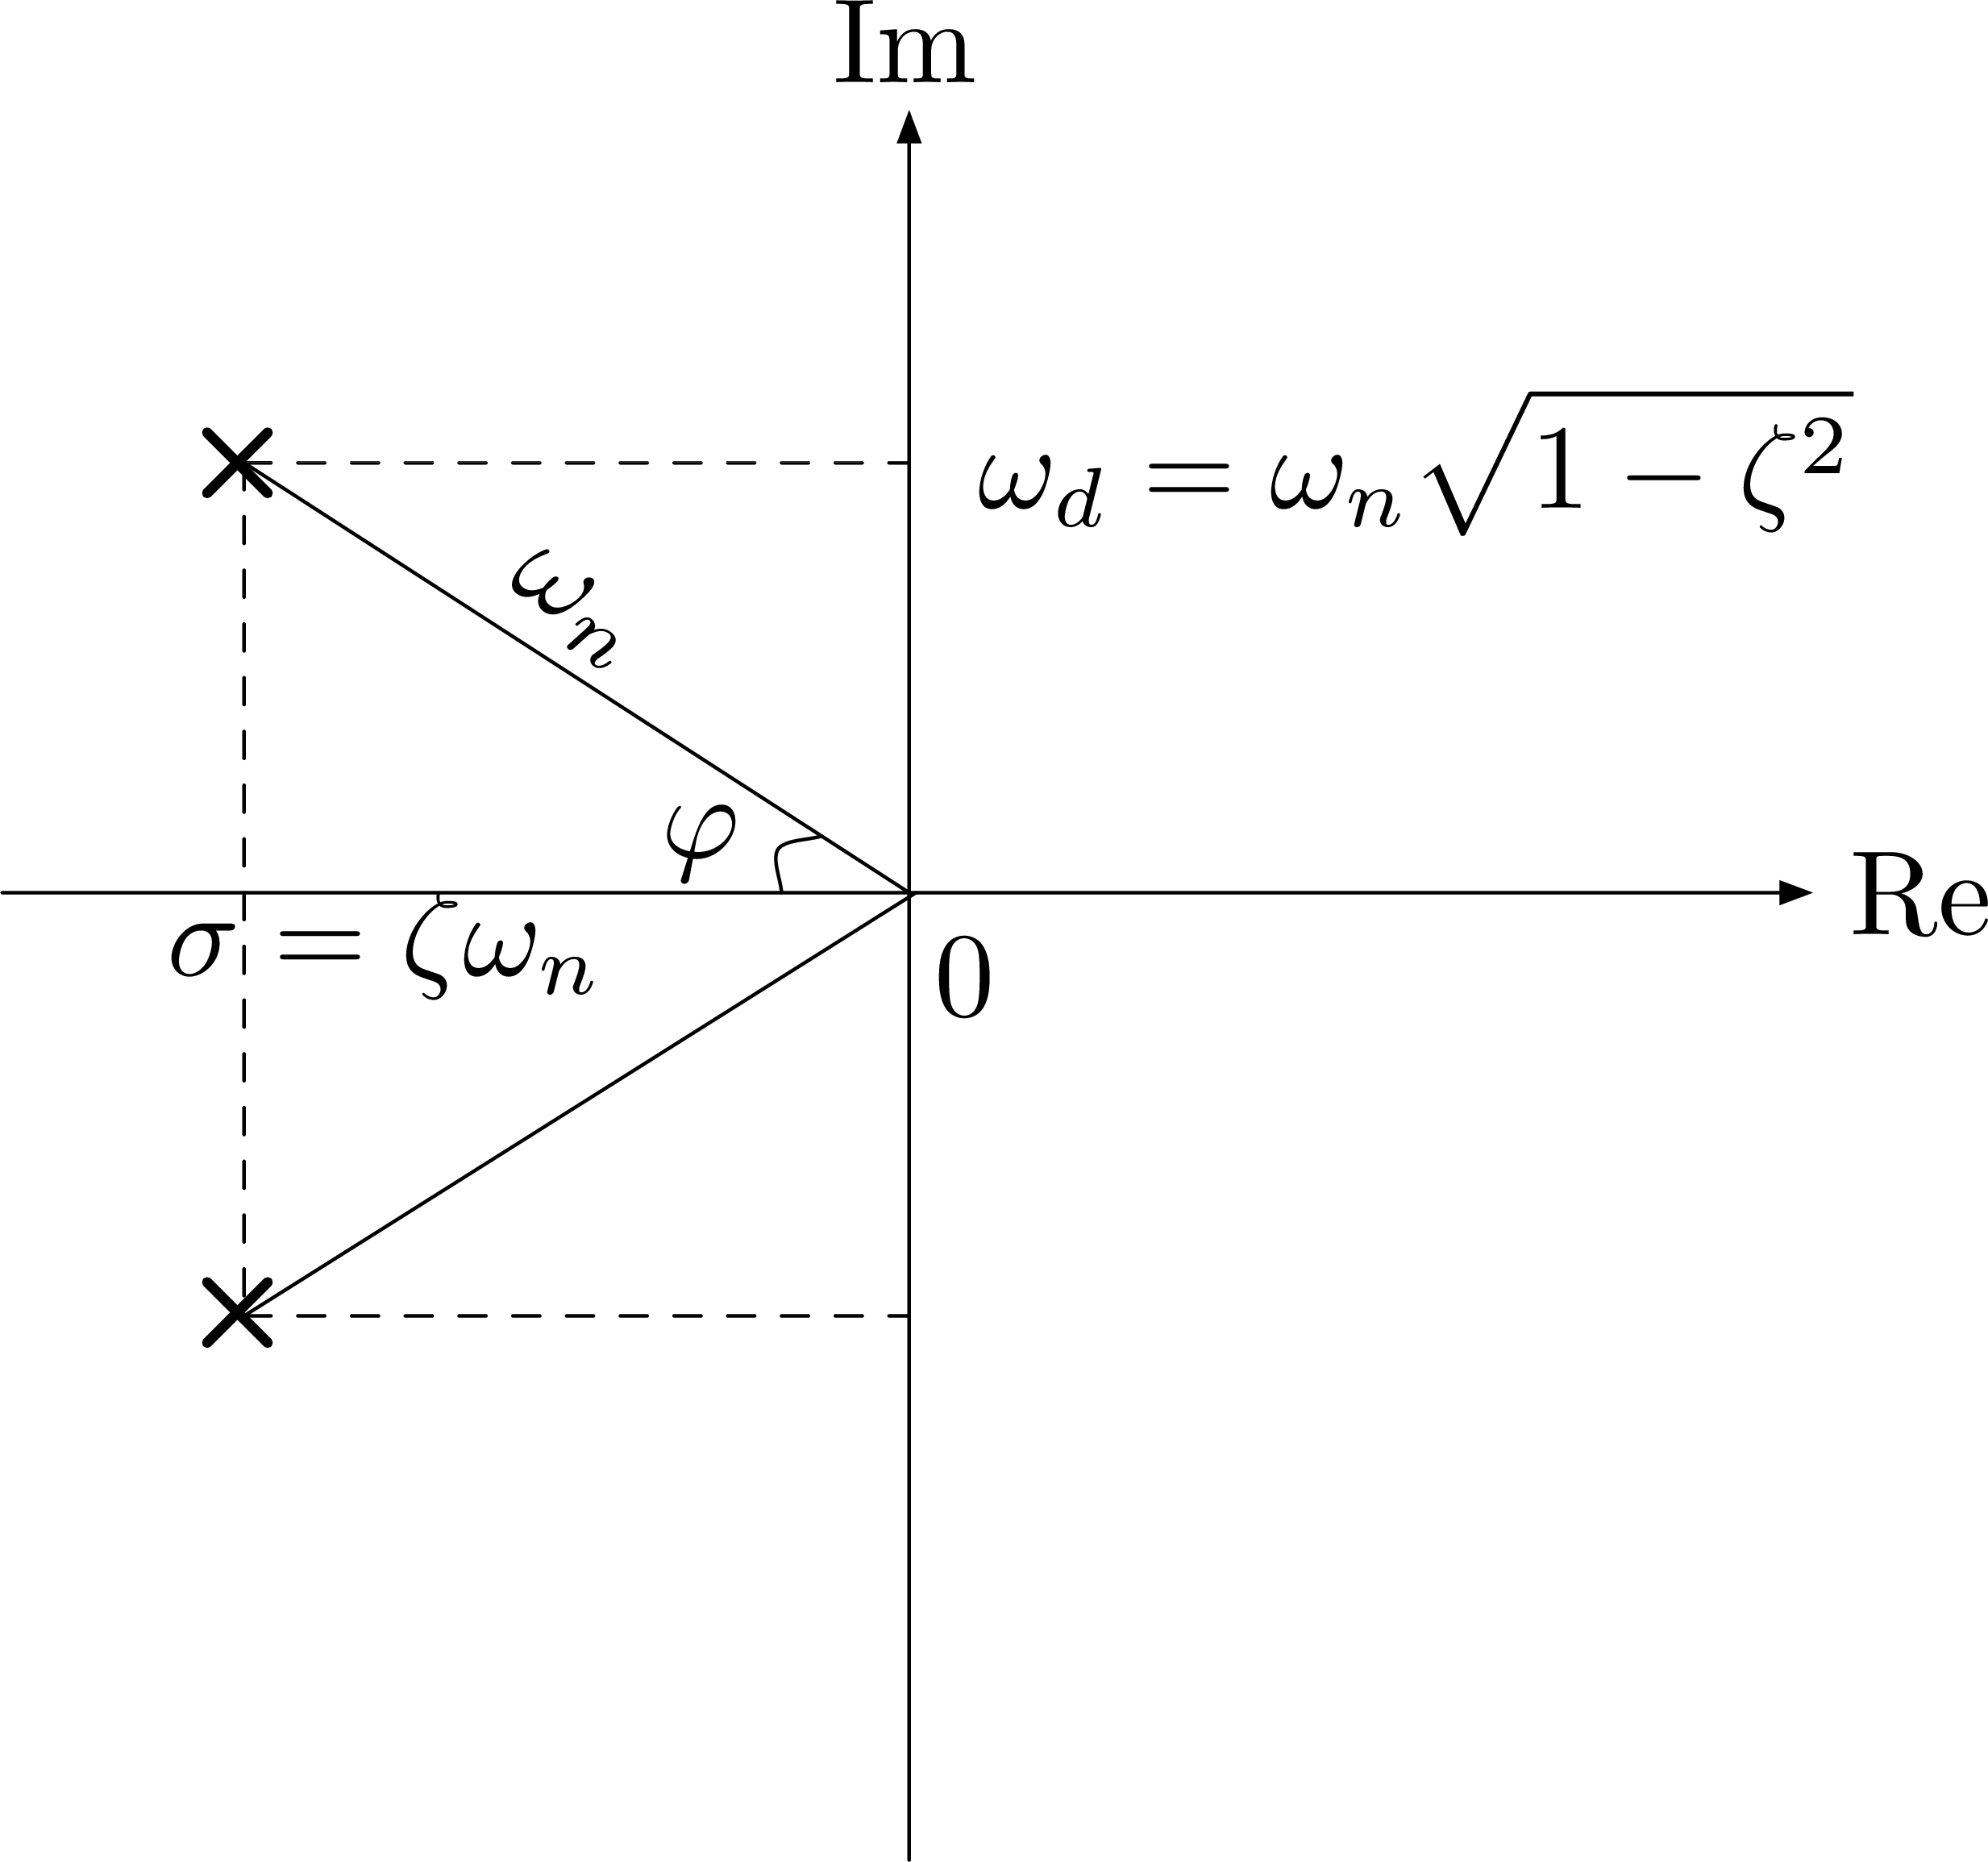
Figure 17: Pole location of underdamped second order system
If we square the real and imaginary parts of poles in Equation \eqref{d5_eq3}, we notice they satisfy the equation of a circle with radius \(\omega_n\) centered at origin. Indeed,
\begin{align*} \text{Re}^2 + \text{Im}^2 &= \omega_n^2 \left( \zeta^2 + \left(\sqrt{1 - \zeta^2}\right)^2 \right) \\ &= \omega_n^2. \end{align*}Also in Figure 17, \(\cos\varphi = \frac{\zeta\omega_n}{\omega_n} = \zeta\).
If we compute the system’s impulse response,
\begin{align*} h(t) &= \LL^{-1}\{ H(s)\} \hspace{5.5cm} \text{(by definition of transfer function)}\\ &= \LL^{-1}\left\{ \frac{\omega^2_n}{s^2 + 2\zeta\omega_n s + \omega^2_n} \right\}\\ &= \LL^{-1}\left\{ \frac{\omega^2_n}{(s+\sigma)^2 + \omega^2_d} \right\} \hspace{3cm} \text{(by the above underdamped poles)} \\ &= \LL^{-1}\left\{ \frac{(\omega^2_n/\omega_d)\omega_d}{(s+\sigma)^2 + \omega^2_d} \right\} \\ &= \frac{\omega^2_n}{\omega_d}e^{-\sigma t}\sin(\omega_d t). \hspace{4.5cm} \text{(by transform table, #20)} \end{align*}Similarly, we can compute the system’s step response due to a unit step,
\begin{align*} y(t) &= \LL^{-1}\left\{ Y(s) \right\} \\ &= \LL^{-1}\left\{ \frac{H(s)}{s} \right\} \hspace{6cm} \text{(by unit system response)}\\ &= \LL^{-1}\left\{ \frac{\sigma^2 + \omega^2_d}{s[(s+\sigma)^2 + \omega^2_d]} \right\} \hspace{3.5cm} \text{(by $\Re(s)$ and $\Im(s)$ on a circle)}\\ &=1-e^{-\sigma t} \left(\cos(\omega_d t) + \frac{\sigma}{\omega_d}\sin(\omega_d t)\right). \qquad \text{(by transform table, #21)} \tag{4} \label{d5_eq4} \end{align*}The graph of the unit step response in Equation \eqref{d5_eq4} of an underdamped second order system for different \(\zeta\)’s is shown in Figure 18.
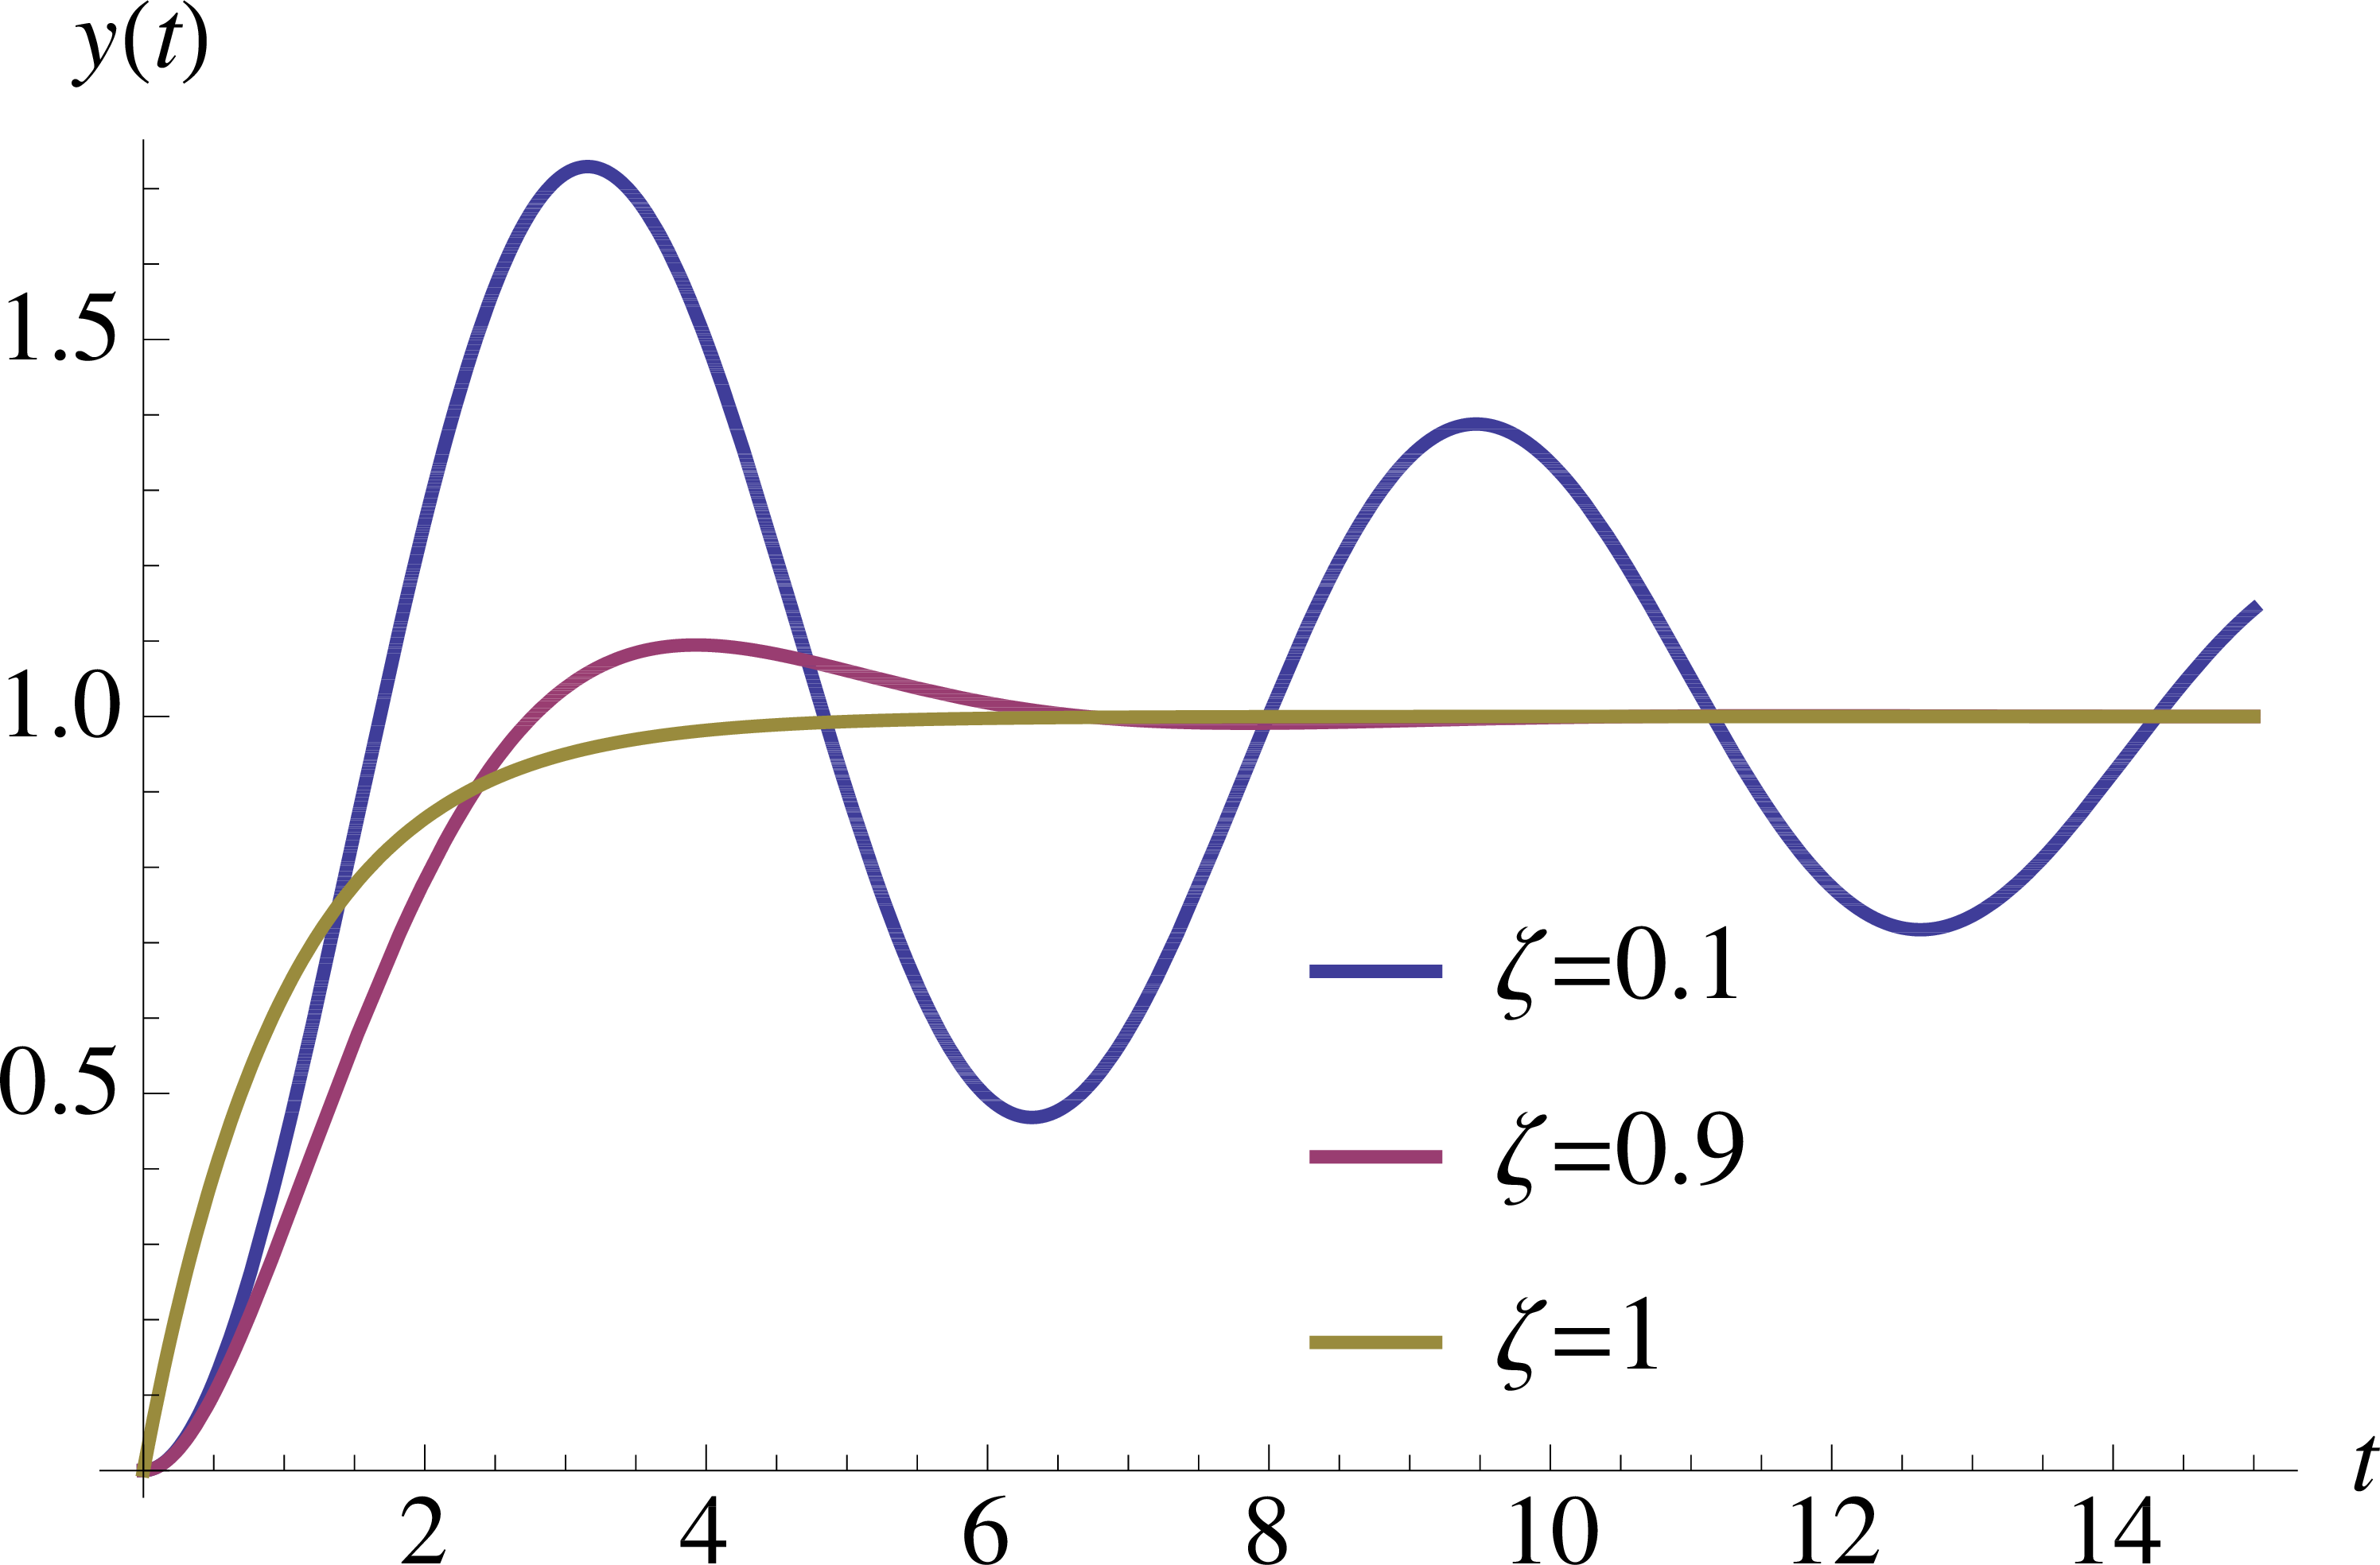
Figure 18: Unit step responses of underdamped second order systems with varying damping \(\zeta\)
From this figure, we notice the decaying rate of the exponential in step response depends on the real part of the pair of complex poles \(\Re(s) = - \sigma = -\zeta \omega_n\), whereas the imaginary part will determine how the step response oscillates while it is decaying. For this reason, \(\omega_d = \omega_n \sqrt{1-\zeta^2}\) is called damped natural frequency.