MP 3: Virtual Memory Page Fault Profiler
Goals and Overview
- You will understand the Linux virtual to physical page mapping and page fault rate.
- You will design a lightweight tool that can profile page fault rate.
- You will implement the profiler tool as a Linux kernel module.
- You will learn how to use the kernel-level APIs for character devices, vmalloc(), and mmap().
- You will test the kernel-level profiler by using a given user-level benchmark program.
- You will analyze, plot, and document the profiled data as a function of the workload characteristics.
Extra Credit Checkpoints
You can earn extra credit by starting on this MP early:
- EC Checkpoint 1: Complete Steps 1-4 by Monday, Mar. 29 at 11:59pm for +5 points.
- EC Checkpoint 2: Complete Steps 1-8 by Monday, Apr. 5 at 11:59pm for +5 points.
TA Walkthrough
Introduction
Due to the ever growing performance gap between memory and hard disk, the management efficiency of the operating system virtual memory system becomes more important to the performance of the whole system. For example, inefficient replacement of memory pages can seriously harm the response time and the throughput of user-level programs. In order to optimize the techniques used as a part of the virtual memory system, it is important to first understand the behavioral characteristics of current virtual memory system for various types of user workloads.
Among the various metrics that can capture the virtual memory system behavior, the major and minor page fault rates and CPU utilization of a user process are important metrics. Here, major page fault is a fault that is handled by using a disk I/O operation (e.g., memory-mapped file), and minor page fault is a fault that is handled without using a disk I/O operation (e.g., allocated by the malloc() function).
Page fault rate provides various kinds of useful information. For example, the page fault rate plotted as a function of allocated memory size shows the thrashing effect. Increasing the degree of multiprogramming also shows how increased page fault rate harms the utilization (or throughput) of the overall system.
In order to accurately measure such metrics (page fault count and CPU utilization), many profiling operations are needed in a short time interval. Because such data are available only in the OS kernel address space, this would cause a non-negligible performance overhead (e.g., switching contexts between user and kernel, copying data between user/kernel address spaces), particular if the processor is implemented as a user space process.
This measurement overhead problem can be addressed by creating a shared buffer between the OS kernel and user-level profiler process. Specifically, by mapping a set of physical pages allocated in the kernel space to the virtual address space of the user-level process, the user-level process can access the data stored in the buffer without any extra overhead other than accessing memory.
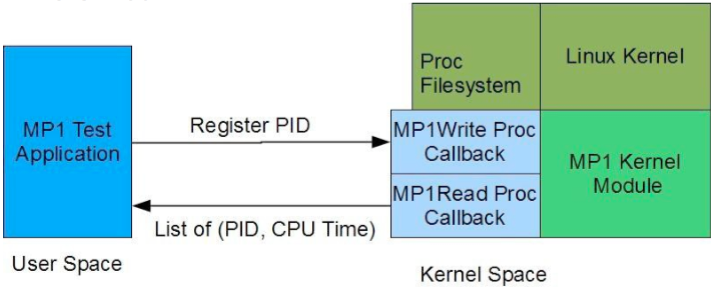
Figure 1 gives an overview of this MP. A set of synthetic user-level work processes is created that emulates different types of memory usage patterns (e.g., in terms of the used memory size and memory access locality). A monitor process in user-level collects the page fault counts and utilization of the work processes and saves the collected data to a file by using a pipe. The saved data stored in a regular file are then plotted to show the page fault rate and CPU utilization as a function of the execution time. Finally, an analysis is done to explain the correlations between the measured page fault rate and utilization, and the characteristics of the used work processes. The synthetic user-level program and the monitor program are provided as a part of this hand-out. The major focus of this MP3 is to build a kernel-level module that harvests the page fault and utilization information of registered tasks and exposes them by using a memory buffer that is directly mapped into the virtual address space of the monitor process.
Developmental Setup
In this assignment, you will again work on the provided Virtual Machine and you will develop kernel modules for the Linux Kernel 4.4.0-NetId that you installed on your machine as part of MP0. Again, you will have full access and control of your Virtual Machine, you will be able to turn it on, and off using the VMWare vSphere Console.
Inside your Virtual Machine you are free to install any editor or software like Gedit, Emacs and Vim. To avoid any interference in your VM from the MP2 grading, make sure to reboot your VM immediately when you start this assignment.
During the completion of this and other MPs, errors in your kernel modules could potentially lead to “bricking” your VM, rendering it unusable. If this happens, please post to Piazza asking for help and a TA will work with Engr-IT to have your VM restored. However, this will cost you precious hours of development time! It is recommended that you backup your work often by using version control and snapshotting your Virtual Machine.
Finally, you are encouraged to discuss design ideas and bugs in Campuswire. Campusewire is a great tool for collective learning. However, please refrain from posting large amounts of code. Two or three lines of code are fine. High-level pseudo-code is also fine.
Starter Code
We have provided some starter code to get started on this MP. Much like in MP1, you will receive this code in your CS 423 github.
-
Create your CS 423 github by following our “Setting up git” guide here, if you have not already done so. If you did MP1, you don’t need to do this again.
-
Run the following commands in your
cs423/netid/git repo:git fetch release git merge release/mp3 -m "Merging initial files"
Problem Description
In this MP, we will be implementing a profiler of page fault rate and CPU utilization for the Linux system. We will implement this profiler in a Linux Kernel module and we will use the Proc filesystem, a character device driver, and a shared memory area to communicate with user space applications. We will use a single Proc file-system entry (/proc/mp3/status) for registering and unregistering monitored user- level processes. The Proc file is accessible by any user. Our profiler should implement three operations available through the Proc file-system (similar to MP3):
-
Registration: This allows the application to notify the profiler kernel module its intent to monitor its page fault rate and utilization. This is done by sending a string formatted as R <PID}>, where
is PID of a process to monitor. -
Unregister: This allows the application to notify the profiler kernel module that the application has finished using the profiler. This is done by sending a string formatted as U <PID>.
-
Read Registered Task List: Additionally, an application running in the system should be able to query which applications are registered. When the entry (/proc/mp3/status) is read by an application, the kernel module must return a list with the PID of each application.
Our profiler will use a character device to map the profiler buffer memory allocated in the kernel address space to the virtual address space of a requesting user-level process. Our profiler will use the mmap operation to map the kernel memory to the address space of a user-level process.
In this MP you are provided with a program that can run as a work process. This program is a single threaded user-level application that allocates a request size of virtual memory space (e.g., up to 2GB) and accesses them with a certain locality pattern (i.e., random or temporal locality) for a requested number of times. The access step is repeated for 20 times. All these three parameters (i.e., memory size, locality pattern, and memory access count per iteration) are provided as shell command line parameters. Using this interface, multiple instances of this program can be created (i.e., forked) simultaneously.
Implementation Overview
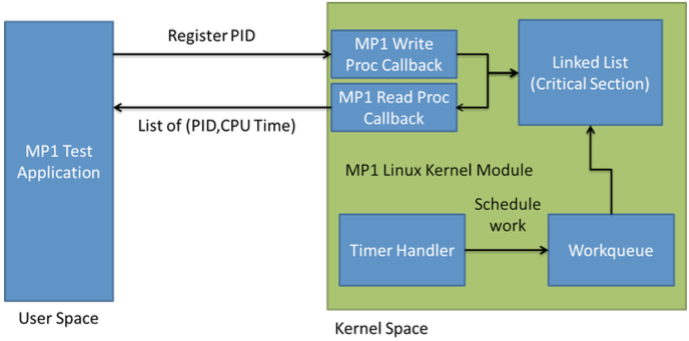
In this section we will guide you through the implementation process. Figure 2 shows the basic architecture of our scheduler.
-
The best way to start is by implementing an empty (‘Hello World!’) Linux Kernel Module. You should also be able to reuse some of the most generic functions you implemented on MP1 and MP3, like linked list helper functions.
- After this you should implement the Proc Filesystem entry. The write callback function should have a switch to separate each type of message (REGISTRATION, UNREGISTRATION). We recommend to add an operation character at the beginning and perform the switch operation over that character. This allows you to receive various types of messages with a single Proc filesystem entry and provide a single unified interface. As an example we show the string formats for each the Proc Filesystem messages:
- For Registration: R <PID>
- For Unregistration: U <PID>
-
You should augment the Process Control Block (PCB). We are not going to directly modify the Linux PCB but instead declare a separate data structure that points to the corresponding PCB of each task. Create a new data structure and add a pointer of type struct task_struct. In Linux this is the data structure that represents the PCB and it is defined in linux/sched.h.
To obtain the task_struct associated with a given PID we have provided you with a helper function in mp3_given.h. This created PCB shall include three variables to keep the process utilization, major fault count, and minor fault count of the corresponding process. -
Now you need to implement registration and unregistration functions. The registration function first adds the requesting process to the PCB list and calls a function that creates a work queue job if the requesting process is the first one in the PCB list. Similarly, the unregister function deletes the requesting process from the PCB list (if exists). Then, if the PCB list is empty after the delete operation, the work queue job is deleted as well.
You should also implement reading from the status file at this point. Recall that reading simply outputs a list of PIDs currently registered. You should simply output one PID per line, with no other text.
-
A memory buffer is allocated in the kernel memory when your kernel module is initialized and is freed when the module is uninitialized. The buffer needs to be virtually contiguous, but does not have to be physically contiguous. This means vmalloc() kernel function can be used instead of kmalloc() for this operation. As physically contiguous memory is scarce, we require you to use vmalloc() as part of this MP. The buffer memory size shall be larger than or equal to 128 x 4 kilobytes. In order to disable management of allocated pages by the virtual memory system, the PG_reserved bit needs to be set.
-
Your kernel module will use a delayed work queue (alternatively you can use a timer and a kernel thread) that periodically measures the major and minor page fault counts, and CPU utilization of all registered user processes and saves the measured information to the memory buffer. We have provided the function get_cpu_use() in mp3_given.h that returns the number of major and minor page faults and CPU utilization in expressed in jiffies. The values returned are the statistics between the previous and the current invocation of get_cpu_use() for the requested process.
The sampling rate of the profiler must be 20 times per second. This means our work handler must be executed 20 times per second by the work queue. The memory buffer is organized as a queue that saves up to 12000 (=20x600) samples. Each sample consists of four unsigned long type data: (a) jiffies value (which is the Linux kernel variable that shows the number of timer ticks executed since the kernel boot-up), (b) minor fault count, (c) major fault count, and (d) CPU utilization. - Your kernel module should use a character device driver to allow user-level process to map the shared memory buffer to its address space. Only three callback functions of the Linux character device driver are used: open, close, and mmap; where open and close callback handlers are defined as empty functions (i.e., function defined but does not have any valid statement to execute).
In order to access this character device from user-level process, a file needs to be created (i.e., as device is represented as a file in UNIX-like OS). The following shell command can be used to create this file which is named as “node”.
$ insmod mp3.ko $ cat /proc/devices <check the created device's major number> $ mknod node c <major # of the device> 0 - The buffer memory is mapped into the virtual address space of a user process upon request (i.e., by the mmap() callback). This is done by mapping the physical pages of the buffer to the virtual address space of a requested user process. For each page of the buffer, the following two kernel functions are used. First, the vmalloc_to_pfn(virtual_address) is used to get the physical page address of a virtual page of the buffer. Second, remap_pfn_range() is used to map a virtual page of a user process to a physical page (which is obtained by the previous function).
This is requested by a user-level process when the process executes the mmap() function on the character device of the kernel module. This implies this mapping shall be done for the range of virtual address space that is passed as parameters of the request of the user process.
Analysis
For the first and second case studies described in this section, all requested graphs need to be plotted in the document. The graph shall be self-contained (i.e., accurately specifying the experimental configurations). Note that if the implementation of your kernel module conveys the specification of this handout, the sampling rate of data plotted in the graphs is 20 samples per second. For any characteristics related to the concepts taught in the VM lectures and any abnormal (non-intuitive) characteristics observed, please describe your analyses such that clearly explain what are the underlying reasons of the observed characteristics and what are the implications for optimizing the system performance.
Case Study 1: Thrasing and Locality
In this case study we will try to understand the page fault rate and CPU utilization as a function of the used memory size and the memory locality. The following parameters are used for the two work processes.
- Work process 1: 1024MB Memory, Random Access, and 50,000 accesses per iteration
- Work process 2: 1024MB Memory, Random Access, and 10,000 accesses per iteration
The shell command to run these work processes and the command to store the profiled data are:
$ nice ./work 1024 R 50000 & nice ./work 1024 R 10000 &
... <after completing the two processes>
$ ./monitor > profile1.data
Plot a graph where x-axis is the time and y-axis is the accumulated page fault count of the two work processes (work processes 1 and 2). Note that if the MP3 kernel module is properly implemented as specified in this handout, each of the profiled page fault count sample represents the number of page faults occur during every 50 milliseconds of interval.
Then, conduct another experiment by using following two work processes.
- Work process 3: 1024MB Memory, Random Locality Access, and 50,000 accesses per iteration
- Work process 4: 1024MB Memory, Locality-based Access, and 10,000 accesses per iteration
The shell commands for this case study are:
$ nice ./work 1024 R 50000 & nice ./work 1024 L 10000 &
... <after completing the two processes>
$ ./monitor > profile2.data
Plot another graph where x-axis is the time and y-axis is the accumulated page fault count of the two work processes (work processes 3 and 4).
Analyze the quantitative differences between these two graphs and discuss where such differences come from. Both the page fault rate and the completion time of the work processes are points of interests in this analysis.
Case Study 2: Multiprogramming
In this case we will analyze the CPU utilization as a function of the degree of multiprogramming. The following parameters are used for the work process 5. We will use N instances of the work process 5 for this study.
- Work process 5: 200MB Memory, Random Locality Access, and 10,000 accesses per iteration
Plot a graph where x-axis is N (i.e., 1, 5, 11, etc.) and y-axis is the total utilization of all N copies of the work process 5. You most likely need to run more N values than just 1, 5, and 11.
Analyze the quantitative differences among the different N values (where N is 1, 5, 11, etc.) and discuss where such differences come from. Both the utilization and the completion time of the work processes are points of interests in this analysis.
Software Engineering
Your code should include comments where appropriate. It is not a good idea to repeat what the function does using pseudo-code, but instead, provide a high-level overview of the function including any preconditions and postconditions of the algorithm. Some functions might have as few as one line of comments, while others might have a longer paragraph.
Also, your code must be split into small functions, even if these functions contain no parameters. This is a common situation in kernel modules because many variables are declared as global, including (but not limited to) data structures, state variables, locks, timers and threads.
An important problem in kernel code readability is to know if a function holds the lock for a data structure or not; different conventions are usually used. A common convention is to start the function with the character ‘_’ if the function does not hold the lock of a data structure.
In kernel coding, performance is a very important issue. The kernel uses macros and preprocessor commands extensively. Proper use of macros and proper identification of possible situations where they should be used are important issues in kernel programming.
Finally, in kernel programming, the use of the goto statement is a common
practice, especially when handling cleanup for memory allocation within a
function. A good example of this is the implementation of the Linux scheduler
function schedule(). In this case, the use of the goto statement improves
readability and/or performance. Spaghetti code is never a good practice.
Submission
To submit your code, ensure you have done both of the following:
-
Turn your code in via git by committing it to your course repo. You can do this via the following commands:
 git add -A
 git commit -m "MP submission"
 git push origin master
Adding a Tag
We will grade your latest pre-deadline commit for each checkpoint and the final MP. However, if you want us to grade a specific commit, you can tag it with a specific tag. Assuming that your tagged commit is before the deadline, we will grade your tagged commit instead of your latest pre-deadline commit. This will allow you to continue to work on your MP after ensuring you have made your submission for the checkpoint.
The tag names to use are as follows:
- For Checkpoint #1:
mp3-cp1 - For Checkpoint #2:
mp3-cp2 - For the final submission:
mp3-final
(If you do not have a tag with the name, we will grade your latest pre-deadline commit+push. It’s not necessary to add the tag, but it may give you extra assurance. :))
Grading Criteria
| Criterion |
|---|
| Read and Write Proc filesystem callbacks parsing the three commands |
| Correct Implementation of the profiler buffer allocation and free |
| Correct Implementation of the work queue (e.g., delayed execution) |
| Correct Implementation of the work queue handler function (e.g., lock) |
| Correct Implementation of the character device (open, close, node file) |
| Correct Implementation of the mmap() of the profiler buffer |
| Graphs and logical analysis for the case study 1 |
| Graphs and logical analysis for the case study 2 |
| Document describing the implementation details and design decisions |
| Your code compiles and runs correctly, and does not use any floating point arithmetic |
| Your code is well commented, readable and follows software engineering principles |
References
- Character device registration (new interface for Linux v2.6). Links Deprecated
- Linux kernel module programming, Chapter 4 Character Device Drivers (an old interface) http://tldp.org/LDP/lkmpg/2.6/html/x569.html
- Linux Device Driver, Chapter 15 Memory Mapping and DMA. https://www.oreilly.com/library/view/linux-device-drivers/0596005903/ch15.html
- Work Queue Tutorial 1 http://www.linuxjournal.com/article/6916?page=0,1
- Work Queue Tutorial 2 https://developer.ibm.com/technologies/linux/tutorials/l-tasklets/
- The Linux Kernel Module Programming Guide (a little outdated, but still useful) http://tldp.org/LDP/lkmpg/2.6/html/index.html
- Linux Kernel Linked List Explained https://rootfriend.tistory.com/entry/Linux-Kernel-Linked-List-Explained
- Kernel API’s Part 3: Timers and lists in the 2.6 kernel https://developer.ibm.com/technologies/linux/tutorials/l-timers-list/
- Access the Linux Kernel using the Proc Filesystem https://developer.ibm.com/technologies/linux/articles/l-proc/
- Linux kernel threads-a simple introduction http://kerneltrap.org/node/20903
- Love Robert, Linux Kernel Development, Chapters 3, 4, 6, 9-12, 17-18, Addison-Wesley Professional, Third Edition