If you have any questions or concerns, please ask in lecture, during office hours, or on Piazza.
Graded work
-
Guided problem sets are auto-graded on PrairieLearn.
-
Homeworks are graded by the entire course staff, directly within Gradescope. To keep grading consistent, each numbered problem is graded by two undergraduate CAs, under the supervision of a graduate TAs, using a detailed rubric developed within Gradescope. Under normal circumstances, homework is graded within 10 calendar days of submission.
-
Exams are graded by Jeff and the graduate TAs, also within Gradescope. Under normal circumstances, exams should be graded within two weeks.
Regrade requests
If you believe that your score for any homework or exam problem is inconsistent with the published grading rubric, or that you were graded more harshly than other students, you can request a regrade.
-
Submit regrade requests for homework and exams within Gradescope. If you have questions or concerns about any grade, we strongly encourage you talk with the course staff before submitting a regrade request. However, no grades will be changed in any student's presence; you must submit an official request.
-
Regrade requests can be submitted up to two weeks after the graded work is released on Gradescope. Regrade requests for the final exam can be submitted up to three weeks after graded exams are released; however, final-exam regrade requests will only be considered if a successful regrade would change the student's course grade.
-
All regrade requests must include a brief written justification for the request. (Fill in the appropriate textbox on Gradescope.) Good justifications include the following:
- My answer agrees with the posted solution, but I still lost points.
- I lost 4 points for an incorrect time analysis, but the rubric says that's only worth 2 points.
- You took off points for missing the base case, but it's right here.
- My answer is correct, even though it does not match the posted solution.
- There is no explanation for my grade.
- I got a perfect score, but my solution has an error. (Extra credit!)
- The official solution is incorrect; here's a counterexample. (Extra credit for everyone!!)
Regrade requests with poor or missing justifications will be denied.
- We can only grade what you actually submitted. You cannot get a higher grade by explaining what you meant, either in person or in writing; your original submission must stand on its own.
-
The first regrade request for any homework problem will be handled by the TA who subpervised the grading of that problem. The first regrade request for any exam problem will be handled by the TA or instructor who graded that problem. Any additional regrade requests for the same problem will be handled by the instructors. Once an instructor issues a final response to a regrade request, all further regrade requests for that problem will be ignored.
-
If you submit a regrade request correctly reporting that a problem was graded too leniently—that is, your score is higher than the published rubric indicates—you will keep your original grade for that problem, and you will be awarded extra credit equal to the grade difference. Yes, really!
-
If a significant error is discovered in a posted homework or exam solution, everyone in the class will receive full credit for that (sub)problem as extra credit. Yes, really!
Overall course grades
Unlike previous offerings of this course, which were graded strictly on a curve, this semester we will be using both absolute letter grade cutoffs and a curve. We will compute letter grades for all students using both methods; each student will receive the higher of the two computed letter grades.
We will determine final course grades as follows. (What do you expect from an algorithms course?)
- Compute raw totals from homework and exam scores, excluding extra credit.
 HwCount  = min(25, max(actual number of homework submissions, 15))
 HwAve    = (sum of HwCount highest homework scores) / (HwCount * 10)
 HwWeight = HwCount * 0.014

 ExAve    = (sum of exam scores) / (max possible sum of exam scores)
 ExWeight = 1.0 - HWweight
 RawTotal = HwAve * HwWeight + ExAve * ExWeight
|
-
21% ≤ Homework ≤ 35%:
-
We expect to assign and grade about 30 homework problems during the semester. For grading purposes, each Guided Problem Set on PrairieLearn has exactly the same weight as one numbered homework problem.
-
Each numbered homework problem or Guided Problem Sets is worth 1.4% of your grade.
-
We will count a maximum of 25 homework problems, dropping the lowest scores if you submit more than 25.
-
If you submit less than 25 homework problems, we will give your exams correspondingly higher weight.
-
Any student who submits less than 15 homework problems will be given an automatic F.
-
65% ≤ Exams ≤ 79%:
There are two midterm exams, each worth about 20% of your raw total, and a cumulative final exam worth about 25% of your raw total, assuming you submit at least 25 homework problems. Again, if you submit less than 25 homework problems, we will give your exams correspondingly higher weight.
-
Exceptions:
- Forgiven homework will be treated as if it did not exist; submitted homeworks will have more weight in the overall grade computation. In exceptional cases, we may compute course grades based entirely on exams.
- Forgiven midterms will be treated as if they did not exist; their other exams will have more weight in the overall grade computation.
- We will not drop zero grades that result from cheating offenses.
- Compute adjusted totals by adding extra credit points to raw totals. Extra credit points are not necessarily worth the same as regular points.
- Identify outliers and exceptional cases.
- Anyone with an adjusted total of at least 95% automatically gets an A+. This rule typically applies to the top 2–3% of the class, but there is no limit on how many students can get an A+. We reserve the right to lower the 95% cutoff.
- We reserve the right to give any student meeting at least one of the following conditions an automatic F:
- Adjusted total below 40%
- Adjusted exam average below 25%
- Submitted less than 15 homework problems
- Otherwise does not appear to making a good-faith effort
This rule typically applies to the bottom 2-3% of the class. These are not the only ways to fail!
- Anyone who misses both the regular final exam and the conflict final exam will be given an ABS (“absent from final”), which is equivalent to an F, unless they get an Incomplete from their college.
- Determine fixed letter grades from adjusted totals, according to the following cutoffs. Each possible letter grade above F covers an interval of length 5%. We reserve the right to lower the cutoffs.
- 95% ≤ A+
- 90% ≤ A < 95%
- 85% ≤ A– < 90%
- 80% ≤ B+ < 85%
- 75% ≤ B < 80%
- 70% ≤ B– < 75%
- 65% ≤ C+ < 70%
- 60% ≤ C < 65%
- 55% ≤ C– < 60%
- 50% ≤ D+ < 55%
- 45% ≤ D < 50%
- 40% ≤ D– < 45%
- 0% ≤ F < 40%
- Determine curved letter-grade cutoffs from the distribution of raw totals. To avoid skewing the curve, outliers are excluded from this cutoff computation, as are students with forgiven exams, a signifcant number of forgiven homework, or zeros from cheating offenses.
- The mean is a borderline B–/C+.
- Each standard deviation is worth one full letter grade.
For example, the B+/B cutoff is 2/3 standard deviations above the mean, and the D/D– cutoff is 5/3 standard deviations below the mean. The fixed cutoffs are consistent with a mean of 70% and a standard deviation of 15%.
- Compute curved letter grades (for non-outliers) from adjusted totals.
- Your actual letter grade is either your fixed leter grade or your curved letter grade, whichever is higher. If the curve would help your grade, we will let it. If the curve would hurt your grade, we will ignore it. There is no budget of As or A+s.
Here are the grade distributions for all of Jeff's previous offerings of CS 374. Like this semester, the mean was set at the C+/B– boundary, and each standard deviation was worth a full letter grade. Spring 2014 and Fall 2014 were pilot offerings, with significantly smaller enrollments, unsettled curricula, and no flexible homework percentage. I do not understand the jump in average scores between Fall 2016 and Spring 2018. Guided Problem Sets and fixed grade cutoffs were introduced in Fall 2021, along with lower weights for exams.
| Semester |
Mean ± stdev |
Min pass |
#As |
#Bs |
#Cs |
#Ds |
#Fs |
| Spring 2014 | 59% ± 11% | 38%
| 8 | 11 | 8 | 8 | 1
|
| Fall 2014 | 62% ± 12% | 38%
| 16 | 22 | 22 | 12 | 0
|
| Fall 2016 | 64% ± 12% | 39%
| 87 | 113 | 124 | 60 | 14
|
| Spring 2018 | 71% ± 13% | 44%
| 70 | 87 | 74 | 36 | 5
|
| Fall 2019 | 71% ± 12% | 47%
| 68 | 101 | 89 | 54 | 8
|
Historically, students' grades in this course are almost entirely determined by their exam scores. In a typical semester:
- About 95% of students submit 100% of the homework problems.
- About two-thirds of students have a homework average over 90%.
- About 90% of students have a homework average over 80%.
(We are well aware that because of COVID, Fall 2021 is not a typical semester.)
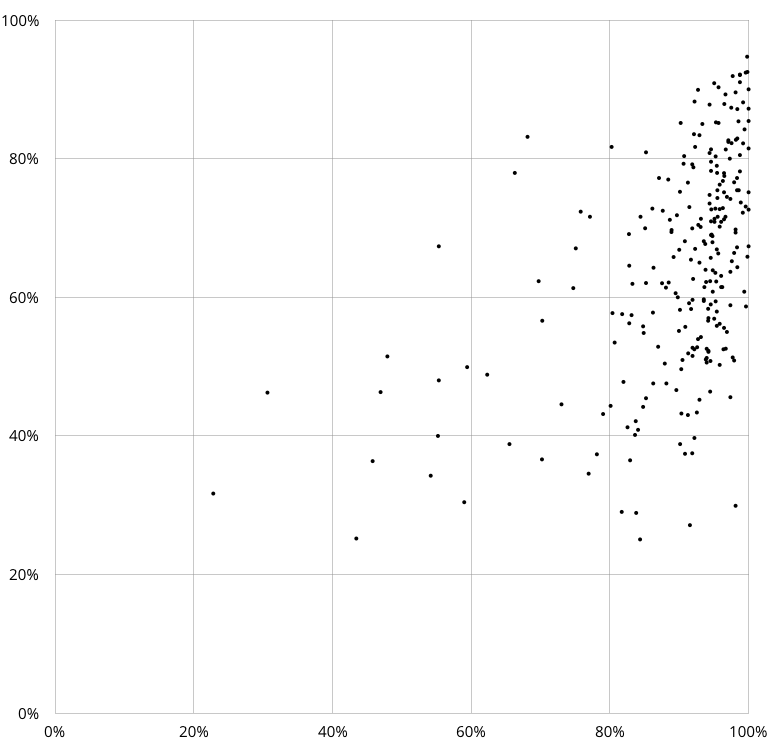
The following scatterplot shows the distribution of homework averages versus exam scores for Fall 2019. Notice especially the outliers: One student had a homework average below 70% but an exam average above 90%; several students had homework average over 90% but exam averages below 40%.