Homework 1
Due September 11 at midnight
Instructions
You should do this homework on your own -- one submission per student, and by submitting you are certifying the homework is your work.
Submission: Homework 1 submission will be via Compass (you should have been signed up automatically, if not please email Rick) Submit your answers, graphs, and other responses as a PDF
Problems
- Choose six of the nine problems at the end of chapter 2 ("First Tools for Looking at Data"), and do them
- Do all the programming assignments at the end of chapter 2, using R
Erratum
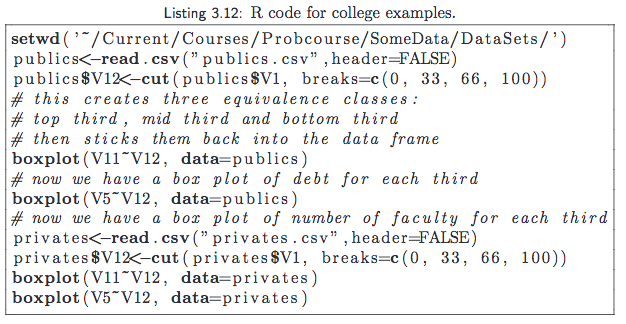
2.14 b reads: "If you run that fragment on your files, then look at the figures, they should suggest that there isn't much difference in faculty per student between top, mid and bottom third public colleges. But there is for private colleges. What happens if you subdivide the top third into smaller pieces? What do you think is going on here?" BUT the data for faculty per student in public colleges is now missing. Rather than answer the question as written (which you can't do), do the following:
2.14(b) substitute: Compare the tuition between private and public colleges (for public colleges, use in-state tuition). Which one varies more? Why? What do you think is going on here?
The code fragment that question 2.14 is referring to is below