Activity 9: Expanding CUMTD API
Due: On git by Thursday, Apr. 18, 2017 at 9:30am
Team: This is a solo assignment; you should type all the code to your solution. However, feel free to get help from others/Google/etc.
Grading: This assignment is the mid-week activity for Experience 8, worth 50 points. There is no partial credit.
Team: This is a solo assignment; you should type all the code to your solution. However, feel free to get help from others/Google/etc.
Grading: This assignment is the mid-week activity for Experience 8, worth 50 points. There is no partial credit.
Introduction
In lecture, you learned how to interact with the CUMTD API. This activity is an open-ended exploration into visualizing that data in a simple way.
Part 1: Setup
We will use the same demo_cumtd_gmaps branch as we used in lecture. If you merged this branch in lecture, it is not necessary to merge it agian.
Part 2: Visualization
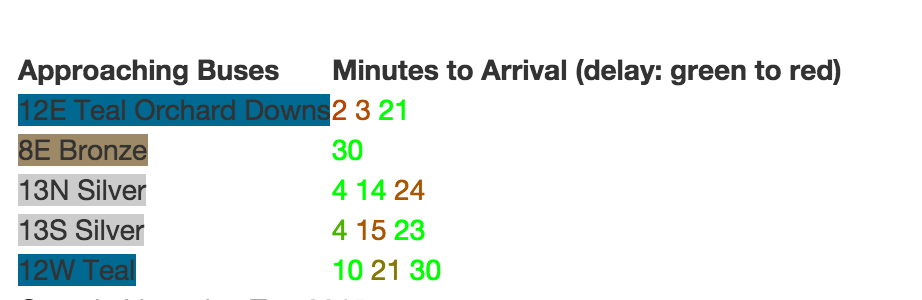
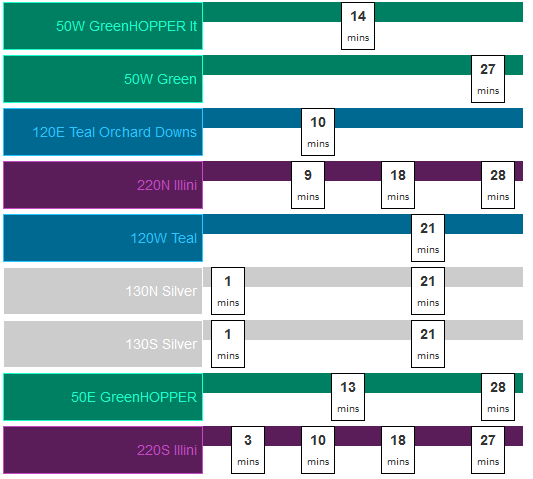
In lecture, you had a working text-based "visualization" in web/vis.js. Transform web/vis.js from a text-based visualization into a visual visualization. It can be as simple or as complex as you desire, though it must have some non-text elements. Here are a few examples:
Submission
This activity is submitted digitally via git. View detailed submission instructions here.