Activity 9: Pathfinding in Interactive Storytelling
Due: On git by Thursday, Oct. 25, 2016 at 11:00am
Team: This is a solo assignment; you should type all the code to your solution. However, feel free to get help from others/Google/etc.
Grading: This assignment is the weekend activity for Experience 8, worth 10 points. There is no partial credit.
Team: This is a solo assignment; you should type all the code to your solution. However, feel free to get help from others/Google/etc.
Grading: This assignment is the weekend activity for Experience 8, worth 10 points. There is no partial credit.
Introduction
In Activity 7, you wrote an interactive story. In Activity 8, you augmented your story with sentiment analysis. In this activity, you will find the most negative and most positive simple paths through your story!
In graph theory, a simple path is a path between two points on a graph that contains no repeated nodes [Read more on Wikipedia].
Part 1: Getting Ready
In order to complete this activity, Activity 8 must be complete and working (you must have computed your if-sa.json file). If you see a visual rendering of your graph in the visualization portion of Activity 8, you're all set!
Additionally, you need to merge the files for this activity into your workbook:
git merge release/exp_activity9 master -m "merge"
Part 2: Programming
For this activity, the core algorithm has been provided for you in Activity 9. That algorithm already in compute.py is as follows:
startNode = find_start_node_id(G)
endNodes = find_end_node_ids(G)
# 2: Find the simple paths between all nodes
pathData = []
for endNode in endNodes:
paths = nx.all_simple_paths(G, startNode, endNode)
for path in paths:
pathData.append({
"path": path,
"weight": find_path_total_sentiment(G, path)
})
# 3: Sort `pathData` for the most positive and most negative paths
pathData = sorted(pathData, key=lambda k: k['weight'])
In Step 2, the code uses our graph library to find all simple paths between the startNode
of your story and every endNode. For each path, this code calls find_path_total_sentiment
to compute the total sentiment of the each path.
In Step 3, the list of all possible paths and their total sentiments are sorted and then saved to a JSON file to be rendered in the visualization.
Your Task
All you need to do is to program the three functions that this code uses:
-
find_start_node_id, a function that takes a NetworkX graphGand returns the node ID of the start node. (Remember from Activity 7, that the start node has an attributestart=True.) -
find_end_node_ids, a function that takes a NetworkX graphGand returns the node ID of every ending node (as a list of strings). An ending node is a node that does not have any edges coming from of the node (no outbound edges). -
find_path_total_sentiment, a function that takes a NetworkX graphGplush an array of node IDs,path, and returns the total sentiment of the path. The total sentiment of the path should be the sum of the sentiment of each node plus the sentiment of each edge.
Part 3: View your most positive and negative stories
After you story is complete, use the Workbook to view two of your stories! You will need to compute (by clicking compute in the workbook) to generate the JSON that will be used to render your story. Once complete, viewing your visualization will allow you to explore your story.
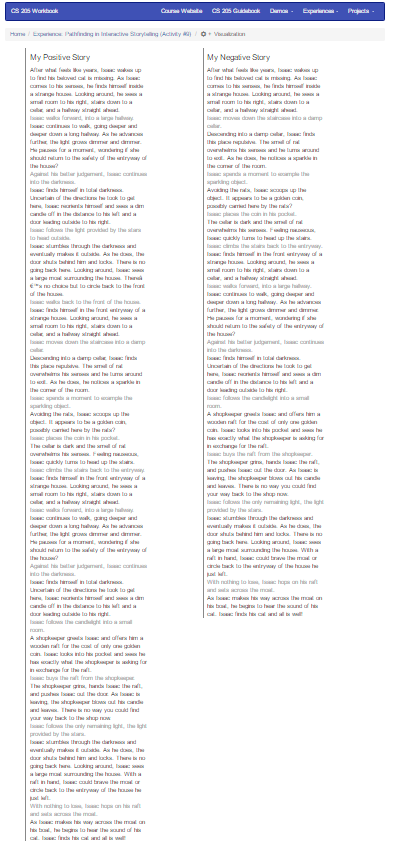
Your two stories will be different. If they're the same, make sure
your find_path_total_sentiment is correct. Here's
an example of my story:
Submission
This activity is submitted digitally via git. View detailed submission instructions here.