Final Project
Simulation Example
Final Project: Simulation Example
This example is to show what one interesting simulation might look like for a givne data set. The simulation is backed by real data from your data set and makes an interesting observation about the data. One of these should be completed by each team member as part of your final project.
Data Set
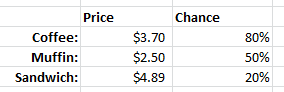
Suppose your data set was the sales of a coffee shop in town. Specifically, you have data on if each customer bought a coffee, muffin, and/or sandwich. By using a pivot table, you generated the percentage that a random customer bought a specific item:
Simulation
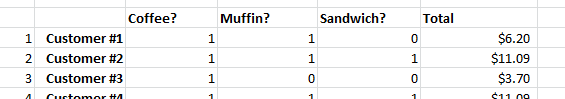
As a simulation, you simulate an average hour of customers (your data suggests
that it's about 25 customers /hour). Using RAND(), you simulate
if each customer will buy a coffee, muffin, and/or sandwich:
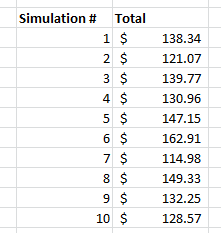
Using F9, you run the simulation many times and record the results:
Observation
Suppose now you want to compare what would happen if you could boost the sales of sandwiches to 30% (though advertisement or otherwise). Re running the simulation with the new probability, you get a new set of results. Taking the average of both simulations, you find that the simulation predicts that you would take in about $6.00 /hr more at your coffee shop:
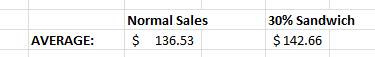
If your coffee shop is open 12 hours /day, that would be about $72.00 more revenue. We would need to know about the cost of the sandwich to know the increase in profit, but this analysis could motivate if it is worthwhile to run a campaign to try to increase the sales of sandwiches.